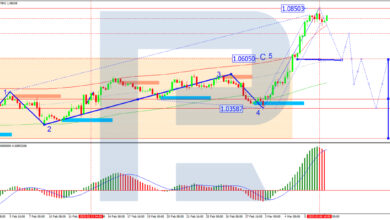
GBP/USD Tries to Overcome 200-Day SMA
- GBP/USD rallies above ascending channel
- Technical oscillators are mixed
GBP/USD is battling with the 200-day simple moving average (SMA) near the 1.2800 area after breaking the ascending channel to the upside. The technical oscillators are showing some contradicting signs as the RSI is moving horizontally below the 70 area, while the stochastic has entered the overbought region with strong momentum.
If prices go up even more, they might run into immediate resistance in the area between 1.2815 and 1.2840. This is where the upper Bollinger band is located and it stands in the way of a rally to the 1.3045 barrier, which was set at the high point on November 6.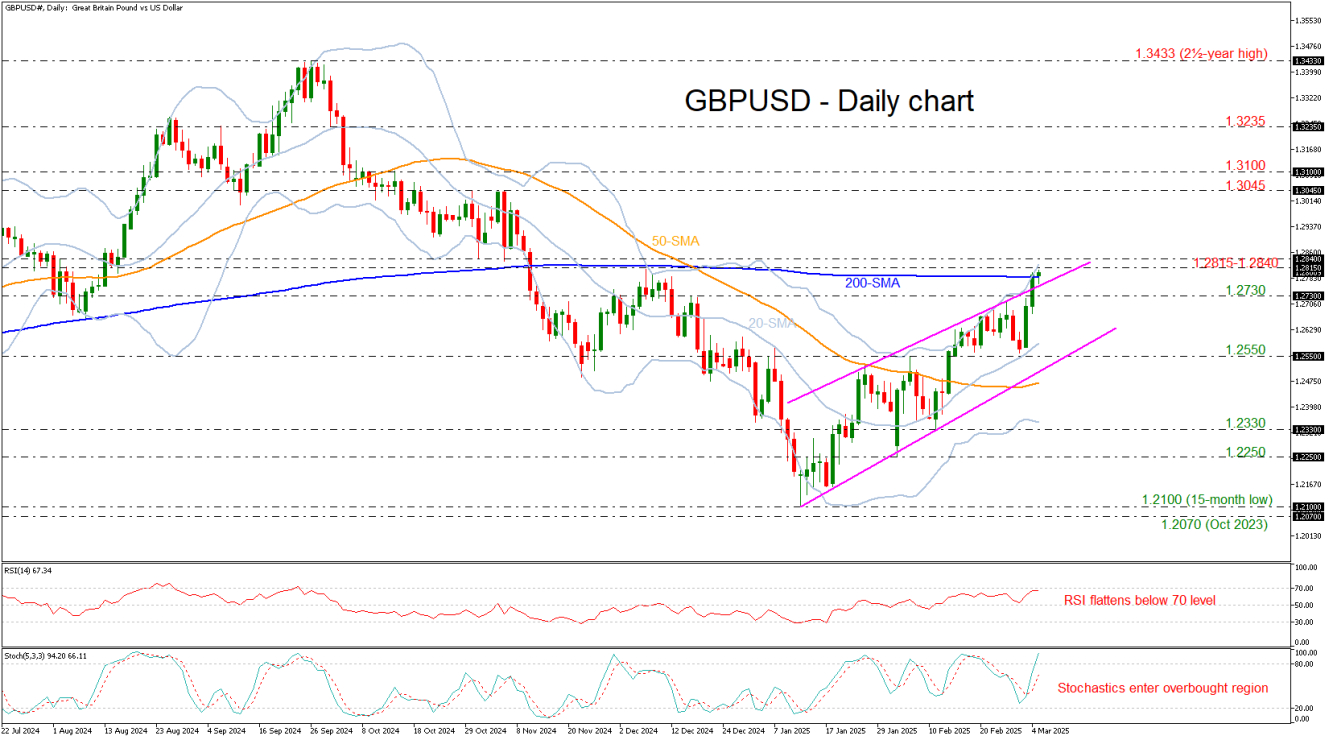
On the other hand, the bears could reach the mid-level of the Bollinger band at 1.2590 and the 1.2550 barricade if they push the price below the 1.2730 support. If traders break the channel to the downside, then the focus would shift to the 50-day SMA at 1.2470. A decline below this line could provide traders with an opportunity to challenge the 1.2330 support level.
To conclude, GBP/USD is raising the likelihood for more upside pressures, especially if there is a closing session beyond the 200-day SMA.